Upcoming Webinars
Check back soon for more webinars!
AI is being used both in chemical and mechanical recycling to optimize processes and understand the additives needed to create a consistent product. In this webinar you will see how the Citrine Platform is used to adapt to varying feedstocks and optimize solvent-based recycling.
Attend this webinar to see how AI is being used to increase the sustainability of polymers by increasing recycled content, removing problem additives and optimizing the lifecycle.
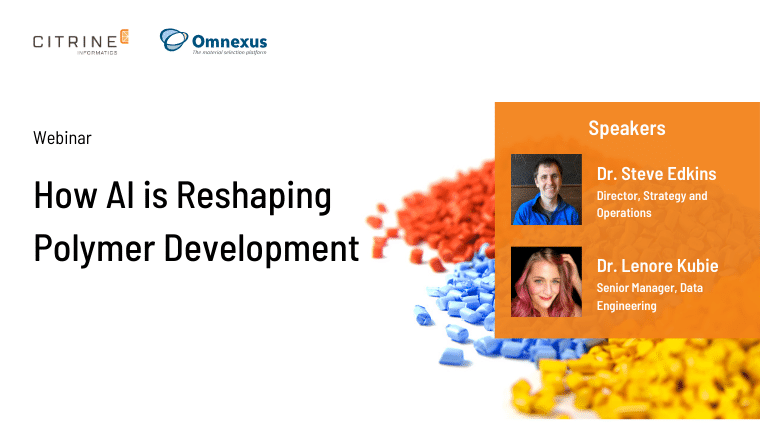
To meet shifts in customer and market demands, supply chain volatility, and emerging regulatory and sustainability initiatives, leaders in Polymers have adopted Artificial Intelligence (AI) to accelerate product ideation, deployment, and scaling.
Coatings, Adhesives and Sealants
This webinar will demonstrate how product teams use the platform to screen new bio-based ingredients, optimize target properties in coatings, and cut reformulation time by 50-80%.
Attend this webinar to learn how Citrine’s customers use AI to optimize adhesive performance while also removing PFAS and moving to bio-based ingredients.
To meet ever-shifting market, customer, and supply demands, leaders in the formulated adhesives industry have adopted artificial intelligence (AI) to accelerate new polyolefin development.
Join Citrine Informatics and Synthomer to learn how AI-driven R&D leverages historical data alongside expert domain knowledge to enable new product development.
Application engineering in the coatings and paints industry is undergoing a revolution, and at its core lies the integration of AI. Learn how leaders have adopted AI to increase the speed with which they can meet emerging needs of customers, unlocking new opportunities, more mature conversations, and secure more...
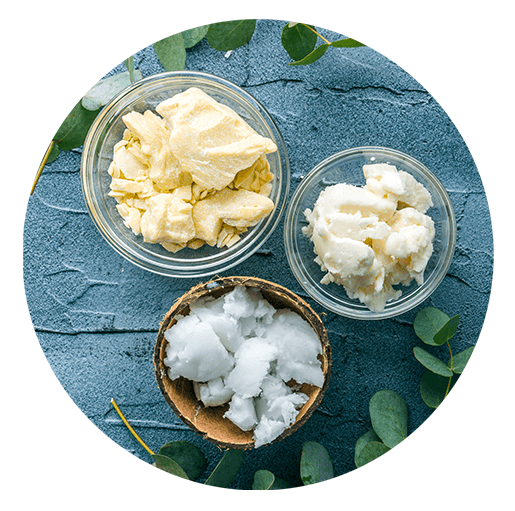
Personal Care and Cosmetics
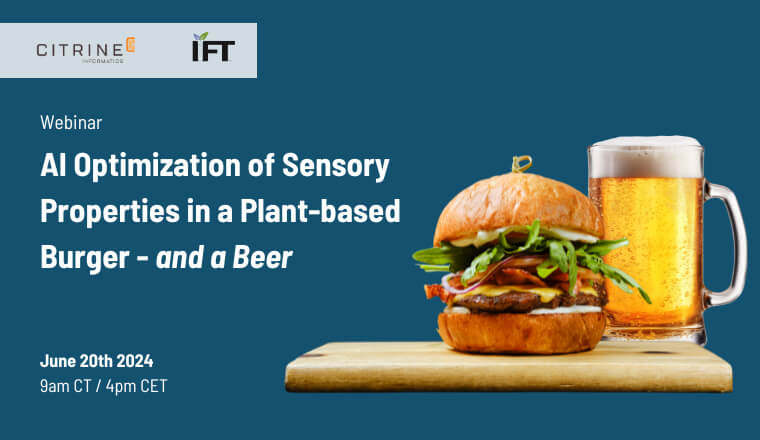
This webinar will focus on how to use machine learning to accelerate your time-to-market with regulatory-compliant, plant-based formulations.
This webinar will explain how machine learning is being used by CPG companies to optimize formulations and how that is resulting in quicker time to market, reduced ingredient costs and better, sustainable products.
Citrine Informatics' AI platform allows brands — from indies to multinationals — to create better, faster. From reformulations targeting greater biobased and sustainable content to time-sensitive on-trend product ideation, Citrine empowers brands to develop consumer-preferred products with precision.
Supply chain disruptions — whether caused by tariffs, natural disasters, or market volatility — demand swift and strategic responses from specialty chemical companies. Citrine’s AI platform empowers organizations to adapt with agility.
Learn how chemicals industry leaders are prioritizing exclusion of per- and polyfluoroalkyl substances from their product development, and leveraging the capabilities of artificial intelligence to quickly react to regulatory changes and position alternatives on the market.
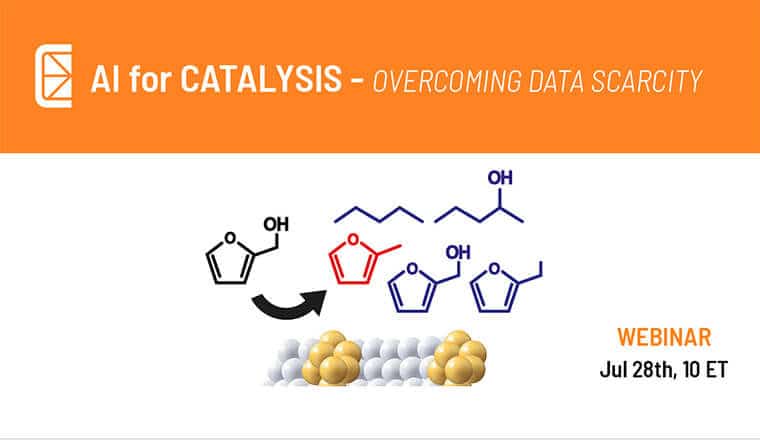
In this webinar, Malcolm Davidson, Citrine’s Senior Data Solutions Engineer, will describe why AI is particularly suited to modeling catalytic reactions and give examples of how the Citrine Platform overcomes the challenge of data scarcity in catalysis projects.
Hear from Vijay Narasimhan, Director of R&D collaborations at EMD Electronics, the Electronics business of Merck, KGaA, Darmstadt, Germany, interviewed by Greg Mulholland, CEO of Citrine Informatics, as he explains how AI was introduced to their central R&D function.
Citrine Informatics' AI platform allows food and beverage companies — from indies to multinationals — to create better, faster. From reformulations reducing sugar, new product ideation with the latest hero ingredient, to process optimization, Citrine empowers brands to develop consumer-preferred products with precision.
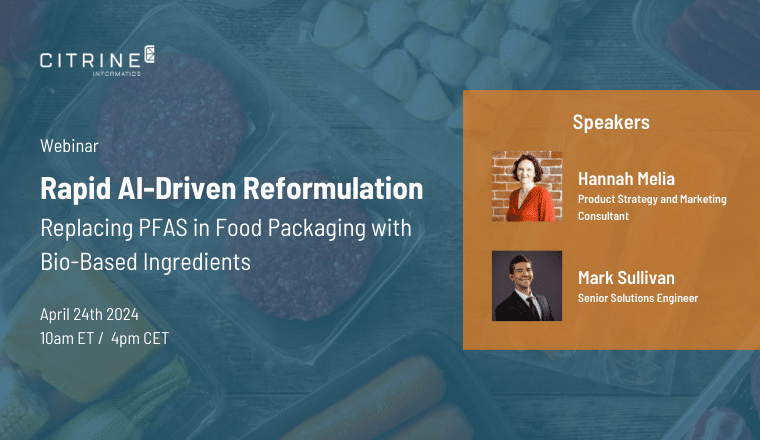
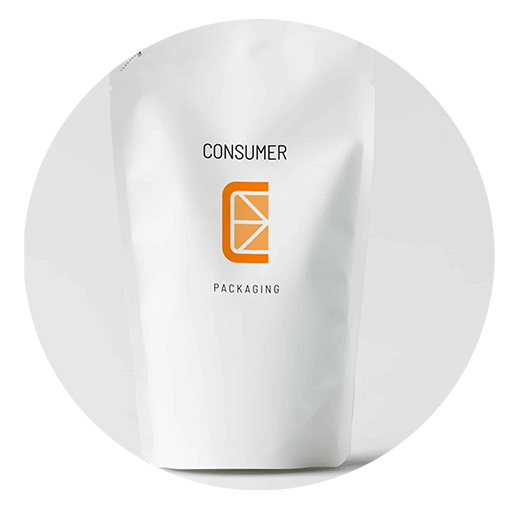
Food retailers are demanding a phasing out of the use of PFAS in food packaging. Consumers are valuing sustainable products. Food and packaging companies need to rapidly reformulate packaging solutions using bio-based ingredients.
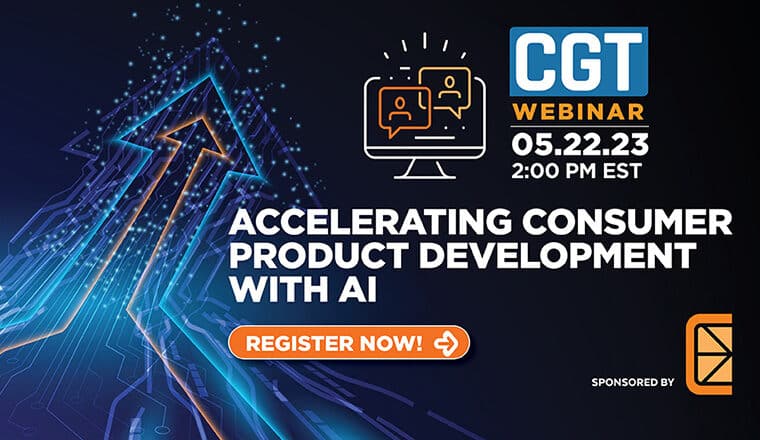
As consumer product innovation organizations continue to navigate supply chain disruption, ever-increasing sustainability objectives, and global economic uncertainty, today’s consumer goods companies must confront these challenges while seeking growth and delighting customers.
This webinar demonstrates how AI is used to accelerate the optimization of multi-layer packaging.
Additives and Ingredients
This webinar will demonstrate how ingredient manufacturers are leveraging the Citrine Platform to optimize production costs, reduce carbon emissions, and minimize energy usage, all while showcasing superior functional performance.
Hear from Vijay Narasimhan, Director of R&D collaborations at EMD Electronics, the Electronics business of Merck, KGaA, Darmstadt, Germany, interviewed by Greg Mulholland, CEO of Citrine Informatics, as he explains how AI was introduced to their central R&D function.
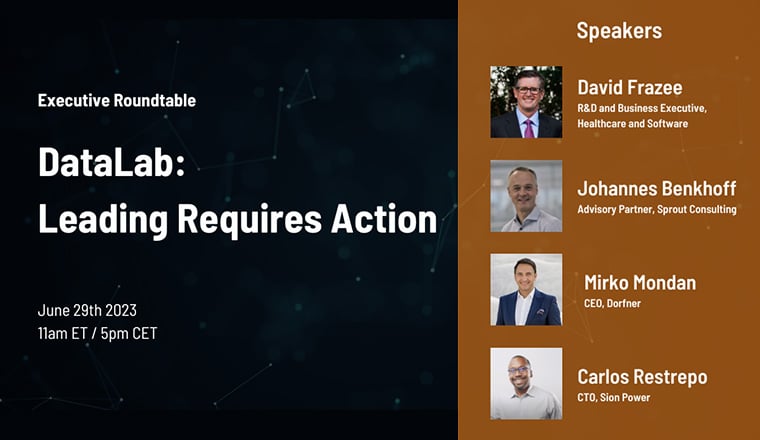
Leading Requires Action is an executive roundtable discussion on the value of implementing AI in product development and R&D, along with how the core challenges to do so are being tackled by the innovators in the materials and chemicals industries.
Join our panel of senior industry executives for a...
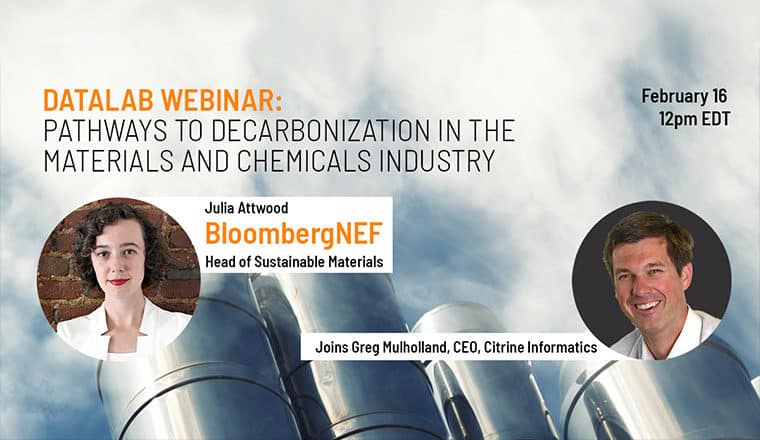
Join our DataLab webinar on February 16th with Citrine CEO, Greg Mulholland, and Dr. Julia Attwood, the Head of Sustainable Materials at BloombergNEF.
Join our DataLab webinar as Greg Mulholland of Citrine Informatics and Dr. Ashish Batra of Corteva discuss how to incorporate sustainability goals into R&D initiatives.
In this webinar, we’re joined by Anantha Desikan, the Executive Vice President and Chief Innovation and Technology Officer at ICL, to discuss sustainability across the agricultural chemical and food supply chain.
In this webinar, learn about the founding, growth, and successes of the Data-Driven Design group within Exxon’s materials research and development organization.
To meet ever-shifting market, customer, and supply demands, leaders in the formulated adhesives industry have adopted artificial intelligence (AI) to accelerate new polyolefin development.
Join Citrine Informatics and Synthomer to learn how AI-driven R&D leverages historical data alongside expert domain knowledge to enable new product development.
Led by Jan Leuridan, SVP at Siemens Digital and Greg Mulholland, CEO at Citrine, this talk was recorded at Siemens Realize LIVE 2020.
Business Case and Concepts
Over the past 12 years, Citrine Informatics has specialized in materials and chemicals informatics, assisting companies like LyondellBasell, Eastman, and Grace in optimizing technical properties, processing parameters, ingredient costs, and sustainability. AI is now not a nice to have, but an essential tool in remaining competitive.
Machine Learning and AI have proven their worth and have been used to accelerate product development, empower scientists, and reduce raw materials and production costs. This webinar will empower you with the questions you need to ask as a leader in the chemical industry.
Larger, chemical companies have been early adopters of AI and have seen significant success at accelerating R&D projects and optimizing processes. But, translating that into lasting business impact is the ultimate goal and getting widespread use of AI as a day-to-day “tool” is a harder challenge within existing structures.
Join Dr. Lenore Kubie and Dr. Robert Kieschke for a webinar discussing how teams can efficiently prepare their data as part of digital transformation initiatives.
In this webinar we will show you both how the Citrine Platform learns from experts and how experts can learn from the AI Models they create to refine their domain knowledge and use it to better choose which experiments to take to the lab.
Supply chain disruptions — whether caused by tariffs, natural disasters, or market volatility — demand swift and strategic responses from specialty chemical companies. Citrine’s AI platform empowers organizations to adapt with agility.
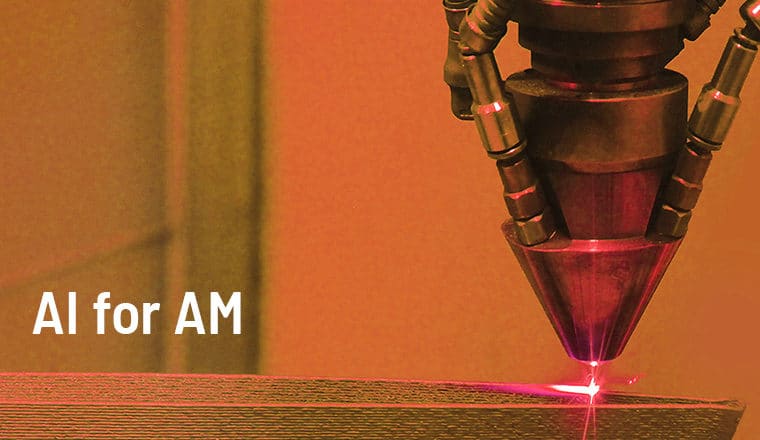
Join our webinar with Dr. James Saal as he discusses how Artificial Intelligence cuts through the complexity of Additive Manufacturing. James will present case studies where Citrine’s technology has been used to solve AM challenges.
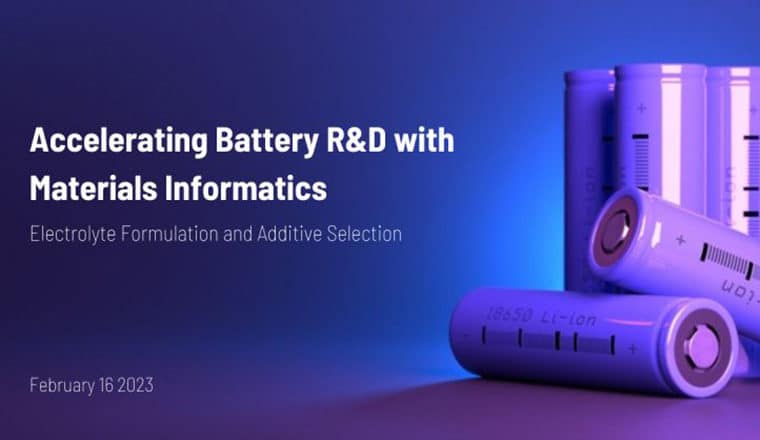
In this webinar, Dr. Jake Mohin will explore how AI & Materials Informatics can be applied to this domain to accelerate cell testing efforts in the face of high battery development demand.
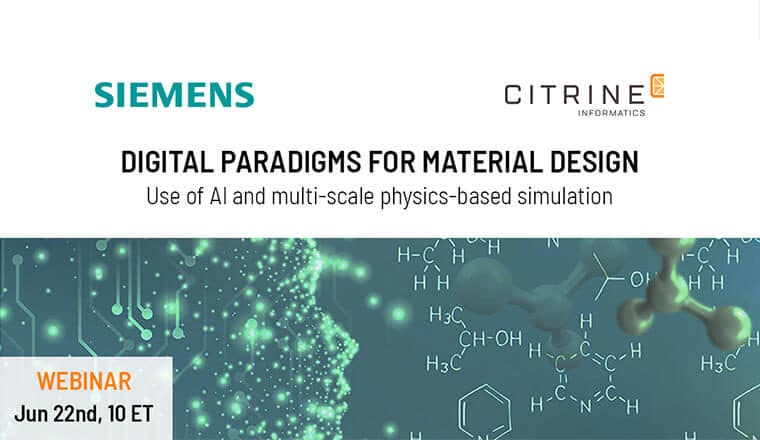
This webinar will showcase the benefits of combining AI with physics-based simulations at different length scales, from atomic and molecular simulation to microstructural modelling tools and FEA.
In this panel discussion, Citrine Informatics’ Director of People Operations, Ify Eva Edwards, sits down with other Diversity, Equity, and Belonging leaders to discuss the impact of solidarity.
In this panel discussion, Citrine Informatics sits down with Diversity, Equity, and Belonging leaders in Tech to discuss systemic and organizational barriers to experiencing belonging at work.
Join Citrine, NIST, Cal Poly, Dow and MIT for a panel discussion about the use of AI for polymers.
Feedback
If you would like to provide suggestions or express support for topics you’d like to see, please email us at content@citrine.io.


 Other
Other