Insight
Data Analysis & Visualization
Help researchers explore trends, validate data quality, understand trade-offs, and share insights that accelerate innovation and strengthen customer conversations.
Data Analysis Workspace
The Citrine Platform’s Data Manager includes a Data Analysis workspace where teams can analyze, visualize, save, and share their data in one place. Citrine gives researchers and product experts a practical way to explore trends, check data quality, understand trade-offs, and communicate what they are learning.
The result is faster learning, stronger domain understanding, and better-informed decisions across product development.
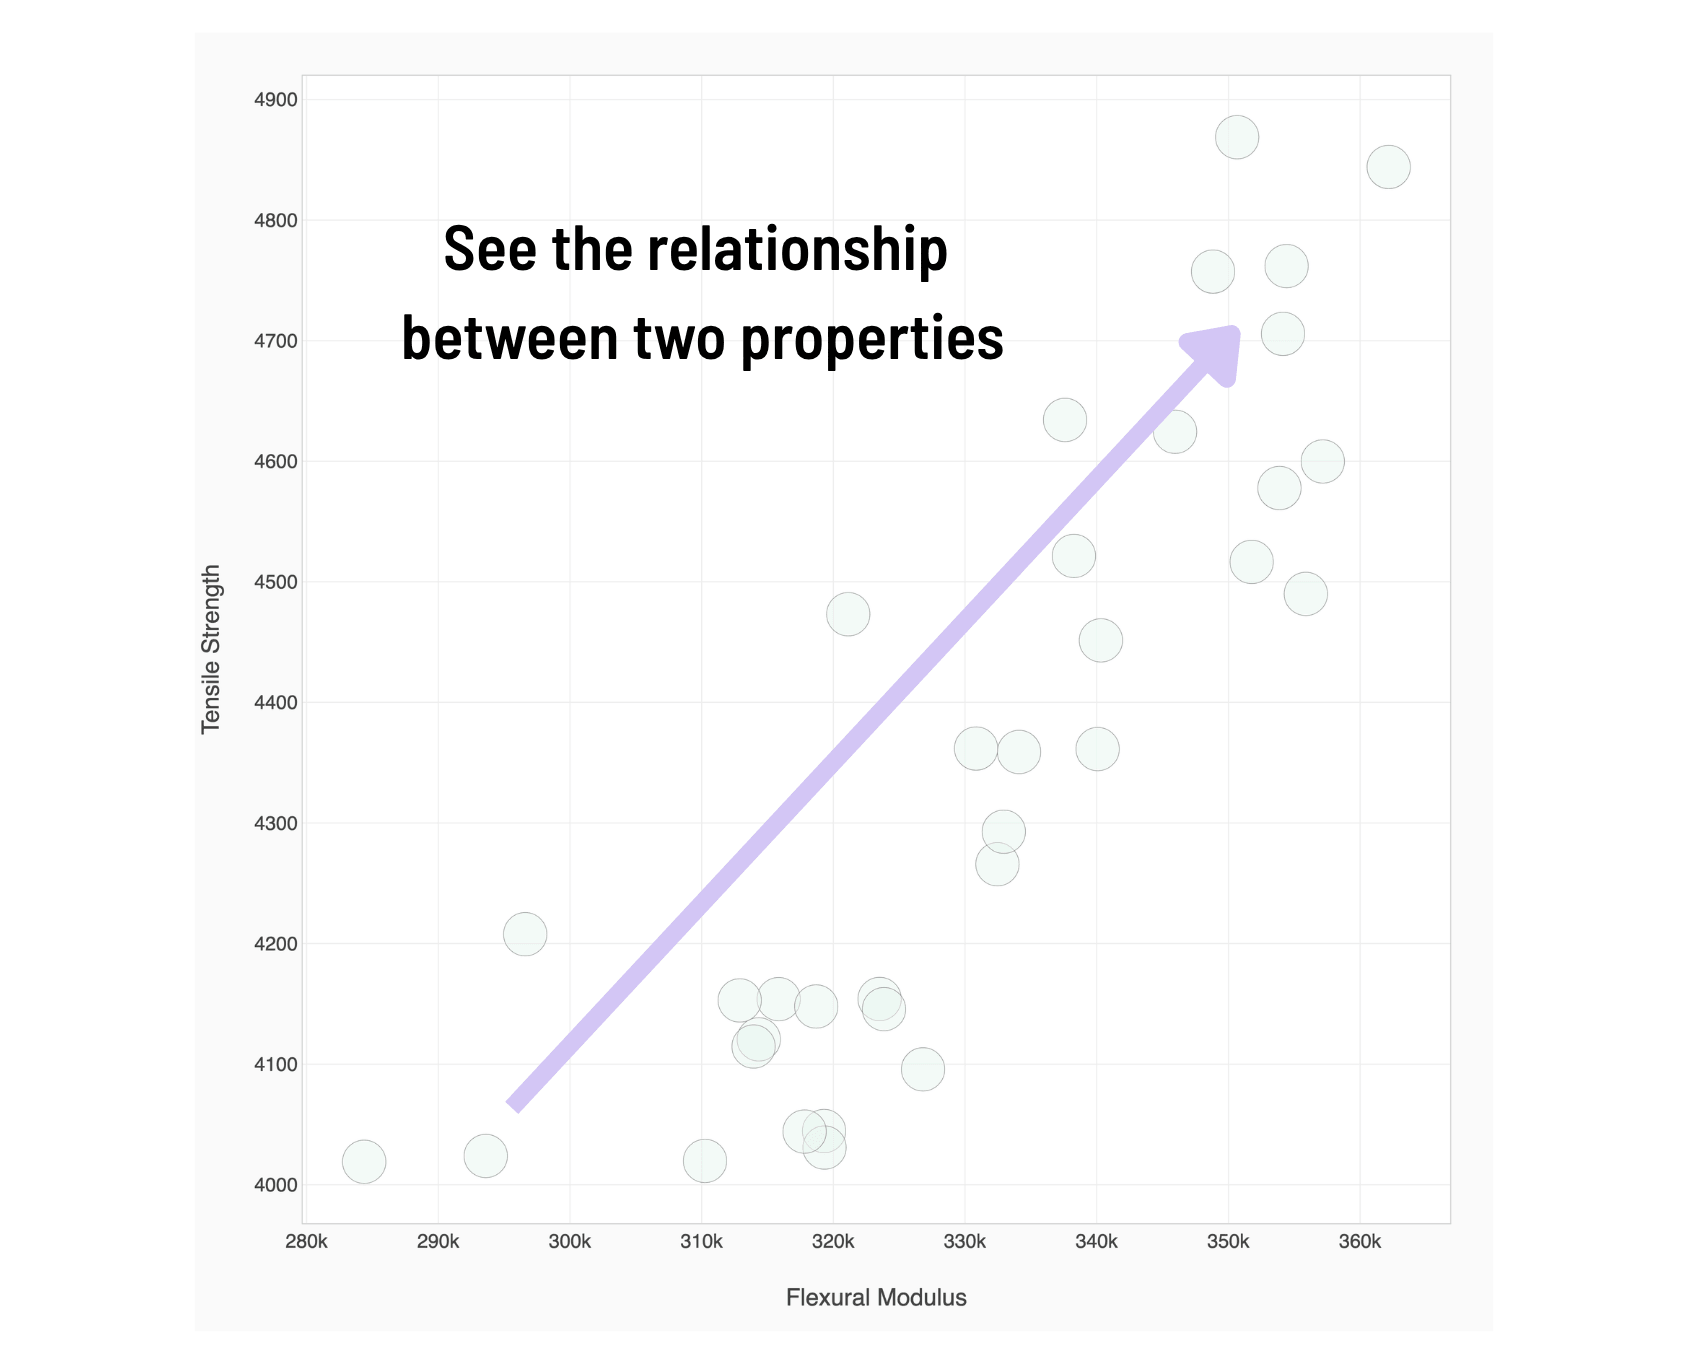
Explore Trends
Uncover patterns across your data
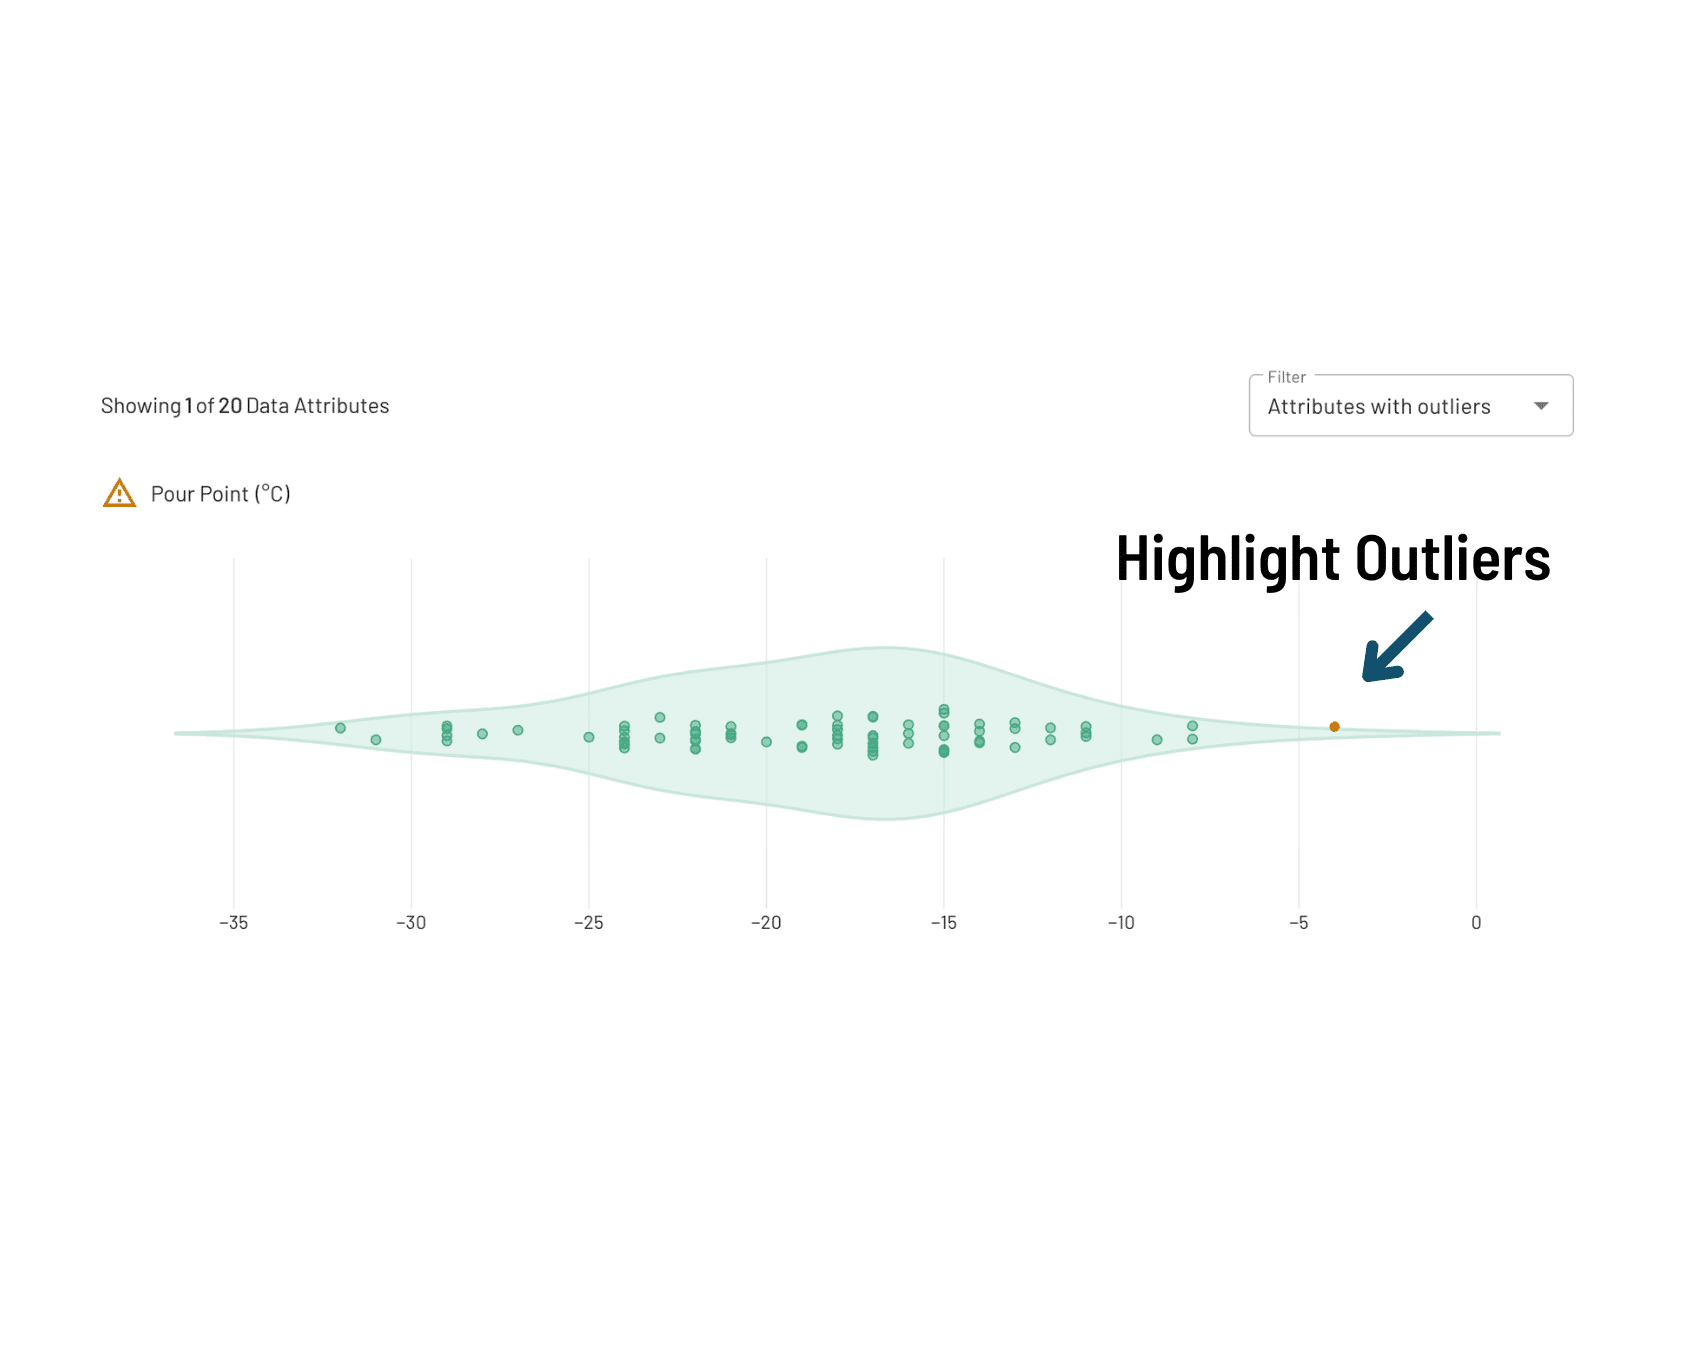
Check Quality
Validate data before it drives decisions
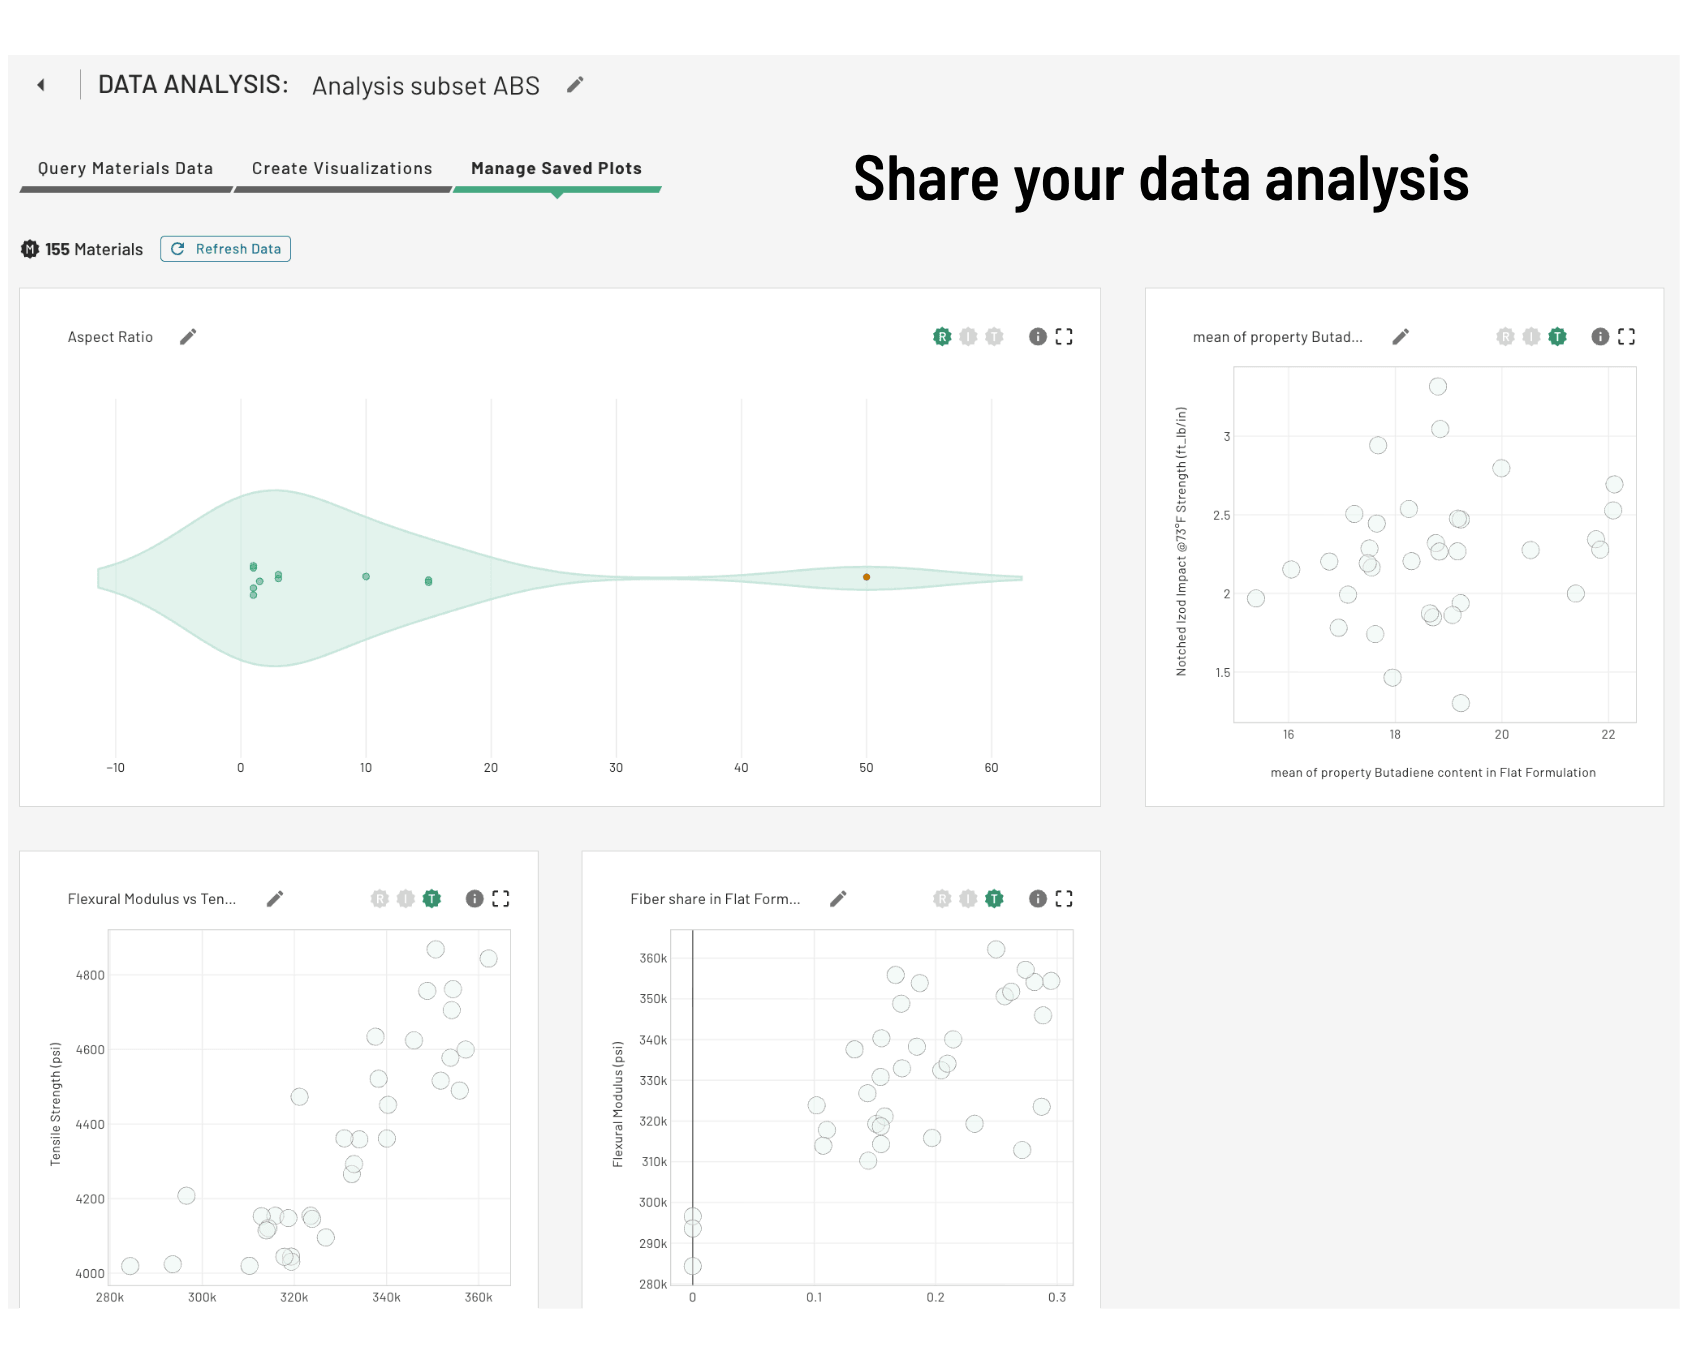
Share Insights
Communicate finding across the team
See More in the Data You Already Have
Most product development teams have valuable data spread across projects, people, and file types. Data Manager brings together raw material, process, intermediate, and final product data across the team—then gives users a place to analyze that full data corpus.
Unified Data Corpus
 Consolidates raw material, process, and final product data across the entire team.
Chemically Aware
Automatically generates molecular descriptors, ingredient fractions, label fractions, and mean ingredient properties.
Understand How Raw Materials Affect Final Performance
For formulators and materials teams, one of the most useful capabilities is exploring how the share of a particular raw material, or a class of raw materials, affects final properties. Citrine automatically calculates ingredient share and label share, then makes those derived features available for visualization.
- Identify which raw materials are driving outcomes
- Determine which raw materials may be interchangeable
- Pinpoint where formulation changes have the most impact
- Support rationalization and supply issue navigation
- Address customer-driven reformulation requests with confidence

Connect Molecular Structure to Product Properties
Because the platform automatically generates chemical features from chemical formulas and molecular structure, teams can go beyond simple spreadsheet comparisons and examine how fundamental chemical characteristics relate to end performance.

Molecular Structure Data
Visualize molecular structure data alongside performance outcomes to reveal deeper connections.
Featurized Variables
Move from surface-level pattern recognition toward informed reasoning about why products behave the way they do.
Trends, Relationships & Trade-Offs
Teams can create custom plots across final product properties, raw material characteristics, processing conditions, price, and chemically aware features. That makes it possible to see trends, correlations, and Pareto-style trade-offs explicitly — visualizing relationships directly to guide technical and business decisions.

Create Visualizations You Can Save, Share & Reuse
Insights become more valuable when they can be communicated clearly. In Data Analysis, users can save plots, export snapshots, share analysis links with teammates, and assemble visualizations into reports that refresh as new data is added.
Individual Exploration
Save and revisit plots as your analysis evolves over time.
Team Knowledge Transfer
Scientists can explain findings; colleagues build on prior work instead of starting over.
Management Visibility
Managers stay closer to project progress through shared, up-to-date visualizations.
Build Stronger Domain Knowledge & Customer Conversations
When teams visualize trade-offs, and connect raw material choices to final performance, they gain a much stronger grasp of their own domain. That deeper understanding helps them innovate faster, and improves how they work with customers.
Faster Innovation
Deeper domain understanding accelerates development cycles
Evidenced-Based Conversations
Replace intuition with visualizations grounded in real data
Customer Alignment
Find products closer to requirements and explain trade-offs clearly